3D Printed IQIs for X-ray Examination: Difference between revisions
| (7 intermediate revisions by the same user not shown) | |||
| Line 1: | Line 1: | ||
== Summary == | == Summary == | ||
These days, when colour images are taken of museum objects it is generally good practice to include a colour calibration chart, like a [http://en.wikipedia.org/wiki/ColorChecker ColorChecker]. This allows the captured images to be colour calibrated and then compared, with reasonable confidence, with other images captured within the same organisation or with image captured using different imaging systems by other individuals or organisations. But | These days, when colour images are taken of museum objects it is generally good practice to include a colour calibration chart, like a [http://en.wikipedia.org/wiki/ColorChecker ColorChecker]. This allows the captured images to be colour calibrated and then compared, with reasonable confidence, with other images captured within the same organisation or with image captured using different imaging systems by other individuals or organisations. But this is often not the case when X-ray images are taken of museum objects. | ||
Calibration targets or Image quality Indicators (IQIs), are available<ref>See http://ndttechnology.blogspot.co.uk/2009/01/image-quality-indicators.html or http://www.ndt-ed.org/EducationResources/CommunityCollege/Radiography/TechCalibrations/controllingquality.htm</ref> for X-radiography and are in fact used in some fields, but they may not be appropriate for all type of cultural heritage X-radiography. In some institutions specialists often construct their own custom IQIs to help ensure the quality of their images. This works well within an institution but is generally less appropriate when comparing images generated by different institutions. | Calibration targets or Image quality Indicators (IQIs), are available<ref>See http://ndttechnology.blogspot.co.uk/2009/01/image-quality-indicators.html or http://www.ndt-ed.org/EducationResources/CommunityCollege/Radiography/TechCalibrations/controllingquality.htm</ref> for X-radiography and are in fact used in some fields, but they may not be appropriate for all type of cultural heritage X-radiography. In some institutions specialists often construct their own custom IQIs to help ensure the quality of their images. This works well within an institution but is generally less appropriate when comparing images generated by different institutions. | ||
As it is becoming easier and more common to share and compare large complex technical images between different cultural heritage institutions the need for | As it is becoming easier and more common to share and compare large complex technical images between different cultural heritage institutions the need for consistent IQIs is becoming more important. This is also becoming an increasingly important issue when it comes to comparing X-ray images produced from analogue film and images created using new digital X-ray systems. | ||
One possible option for producing consistent, but custom designed, IQIs, tailor made for the examination of specific groups of cultural heritage materials might be the use of new 3D-printers. This pilot study was put together to begin to explore this possibility. | One possible option for producing consistent, but custom designed, IQIs, tailor made for the examination of specific groups of cultural heritage materials might be the use of new 3D-printers. This pilot study was put together to begin to explore this possibility. | ||
| Line 11: | Line 11: | ||
== 3D Printed Samples == | == 3D Printed Samples == | ||
The following samples | The following samples were made by the Rapid Manufacturing Team at [http://www.renishaw.com Renishaw plc.], which has been coordinated by [http://www.uwe.ac.uk/sca/research/cfpr/dissemination/funding/ktpawards.html Knowledge Transfer Partnership (KTP)] Associate [http://www.uwe.ac.uk/sca/research/cfpr/staff/sophie_adams_foster/index.html Sophie Adams Foster] in collaboration with [http://www.uwe.ac.uk/sca/research/cfpr/staff/carinna_parraman/index.html Carinna Parraman] at [http://www.uwe.ac.uk/ University of the West of England Bristol]. | ||
{| class="wikitable sortable" | {| class="wikitable sortable" | ||
|- | |- | ||
| Line 22: | Line 22: | ||
| 3 || SLS: EOS P385 || Glass Filled Nylon || Selective Laser Sintering || 150 Microns || Light Grey | | 3 || SLS: EOS P385 || Glass Filled Nylon || Selective Laser Sintering || 150 Microns || Light Grey | ||
|- | |- | ||
| 4 || Object Eden 250 || Photo-cure || Poly-Jet Printer || 16 - 32 Microns || White | | 4 || Object Eden 250 || Photo-cure Acylic || Poly-Jet Printer || 16 - 32 Microns || White | ||
|- | |- | ||
| 5 || Z-Corp || Plaster of Paris || Powder based system with a binder using Ink Jet technologies || 100 Micorns at 460DPI || Bright White | | 5 || Z-Corp || Plaster of Paris || Powder based system with a binder using Ink Jet technologies || 100 Micorns at 460DPI || Bright White | ||
| Line 31: | Line 31: | ||
=== X-ray procedure === | === X-ray procedure === | ||
<gallery> | <gallery> | ||
File:3D printed X-ray IQIs 01.jpg| Figure 1: NG Lead lined X-ray Source Table, with the 3D-printed wedges | File:3D printed X-ray IQIs 01.jpg| Figure 1: NG Lead lined X-ray Source Table, with the sample 3D-printed wedges. | ||
File:3D printed X-ray IQIs 02.jpg| Figure 2: The 5 bags of the 3D-printed wedges | File:3D printed X-ray IQIs 02.jpg| Figure 2: The 5 bags of the sample 3D-printed wedges. Including the details provided for each of the samples. | ||
File:3D printed X-ray IQIs 03.jpg| Figure 3: The 5 sets of 3D-printed wedges arranged on the window above the X-ray source, along with an unused sheet of the [[media:Ti2294_Kodak_industrex_aa400.pdf|Kodak Industrex AA400]] X-ray Film within its paper envelope. | File:3D printed X-ray IQIs 03.jpg| Figure 3: The 5 sets of 3D-printed wedges arranged on the window above the X-ray source, along with an unused sheet of the [[media:Ti2294_Kodak_industrex_aa400.pdf|Kodak Industrex AA400]] X-ray Film within its paper envelope. | ||
File:3D printed X-ray IQIs 04.jpg| Figure 4: The 5 sets of 3D-printed wedges arranged on the window above the X-ray source. | File:3D printed X-ray IQIs 04.jpg| Figure 4: The 5 sets of 3D-printed wedges arranged on the window above the X-ray source. | ||
| Line 46: | Line 46: | ||
'''Profile extraction''' | '''Profile extraction''' | ||
* Using [http://www.vips.ecs.soton.ac.uk/ Nip2], | * Using [http://www.vips.ecs.soton.ac.uk/ Nip2], an arrow was marked across the central length of each image of each sample wedge, see figure 6. | ||
* Each arrow was then used to extract a region of the image across each wedge 10 pixels high, which was then averaged down to a single pixel high, see figure 7. | * Each arrow was then used to extract a region of the image across each wedge 10 pixels high, which was then averaged down to a single pixel high, see figure 7. | ||
* The image profile was then flipped left-right if required to ensure that each wedge was represented, left to right, going from thick to thin. | * The image profile was then flipped left-right if required to ensure that each wedge was represented, left to right, going from thick to thin. | ||
| Line 99: | Line 99: | ||
== References == | == References == | ||
<references/> | <references/> | ||
[[Category:Digital Imaging]] | |||
Latest revision as of 10:06, 12 April 2012
Summary
These days, when colour images are taken of museum objects it is generally good practice to include a colour calibration chart, like a ColorChecker. This allows the captured images to be colour calibrated and then compared, with reasonable confidence, with other images captured within the same organisation or with image captured using different imaging systems by other individuals or organisations. But this is often not the case when X-ray images are taken of museum objects.
Calibration targets or Image quality Indicators (IQIs), are available[1] for X-radiography and are in fact used in some fields, but they may not be appropriate for all type of cultural heritage X-radiography. In some institutions specialists often construct their own custom IQIs to help ensure the quality of their images. This works well within an institution but is generally less appropriate when comparing images generated by different institutions.
As it is becoming easier and more common to share and compare large complex technical images between different cultural heritage institutions the need for consistent IQIs is becoming more important. This is also becoming an increasingly important issue when it comes to comparing X-ray images produced from analogue film and images created using new digital X-ray systems.
One possible option for producing consistent, but custom designed, IQIs, tailor made for the examination of specific groups of cultural heritage materials might be the use of new 3D-printers. This pilot study was put together to begin to explore this possibility.
3D Printed Samples
The following samples were made by the Rapid Manufacturing Team at Renishaw plc., which has been coordinated by Knowledge Transfer Partnership (KTP) Associate Sophie Adams Foster in collaboration with Carinna Parraman at University of the West of England Bristol.
| No. | Printer Name | Material | Process | Resolution | Colour |
|---|---|---|---|---|---|
| 1 | Envision Tec | Photo-cure Acylic | Direct Light Projecting | 25 - 50 Microns | Dark Red |
| 2 | Dimension | ABS | Extrusion | 250 Microns | Black |
| 3 | SLS: EOS P385 | Glass Filled Nylon | Selective Laser Sintering | 150 Microns | Light Grey |
| 4 | Object Eden 250 | Photo-cure Acylic | Poly-Jet Printer | 16 - 32 Microns | White |
| 5 | Z-Corp | Plaster of Paris | Powder based system with a binder using Ink Jet technologies | 100 Micorns at 460DPI | Bright White |
National Gallery Examination
X-ray procedure
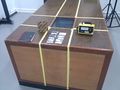
Figure 1: NG Lead lined X-ray Source Table, with the sample 3D-printed wedges.
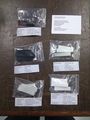
Figure 2: The 5 bags of the sample 3D-printed wedges. Including the details provided for each of the samples.
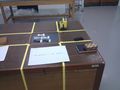
Figure 3: The 5 sets of 3D-printed wedges arranged on the window above the X-ray source, along with an unused sheet of the Kodak Industrex AA400 X-ray Film within its paper envelope.
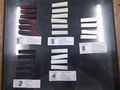
Figure 4: The 5 sets of 3D-printed wedges arranged on the window above the X-ray source.


Data Processing
Image preparation
- Each X-ray plate was scanned at 600 DPI and saved as a 1-band 16-bit tif image.
- All additional images processing was carried out using the Nip2 software.
- The resultant X-ray images where balanced, as required, to calibrate for slightly uneven exposure of the plates, principally some appeared slightly brighter along the side edges, see figure 5.
- The images for the examinations at 50KV, 40KV and 30KV required this process.
Profile extraction
- Using Nip2, an arrow was marked across the central length of each image of each sample wedge, see figure 6.
- Each arrow was then used to extract a region of the image across each wedge 10 pixels high, which was then averaged down to a single pixel high, see figure 7.
- The image profile was then flipped left-right if required to ensure that each wedge was represented, left to right, going from thick to thin.
- Each image was then resized to ensure that the thickest point of each wedge was at about 250 pixels and a total of 1500 pixels wide.
- Each 1x1500 pixel images was then converted into numbers and saved as the raw data displayed in the graphs.
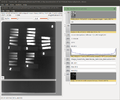
Figure 5: Performing horizontal balancing of X-ray images, using Nip2.
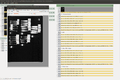
Figure 6: Positioning arrows across an X-ray image to indicate the position of each of the wedges, using Nip2.
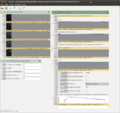
Figure 7: Extraction the profile of one example wedge, using Nip2.

Profile Extraction Macro
The actual process of extracting the profile data from each arrow was simplified using the following Nip2 marcro.
Process_Wedges_Prep = class
  Menuaction (_ "Process Wedges Prep") (_ "IQIs") {
    action x = class
      _result {
        _vislevel = 3;
        _w = 10;
        _area = extract_arrow 0 0 _w x;
        _sa = scale _area;
        im = image_set_type Image_type.B_W _sa;
        pt = Mark_relative im 0.1 0.5;
        _a' = resize Interpolate_bilinear 1 (1 / _w) _area;
        _a'' = _a', pt.left < (im.width/2)
             = fliplr _a';
        _ofs = 250 - pt.left, pt.left < (im.width/2)
             = 250 - (im.width - pt.left);
        _nw = 1500;
        _bg = Image (image_new _nw 1 1 _a''.format _a''.coding _a''.type 0 0 0);
	_result = insert_noexpand _ofs 0 _a'' _bg;
        }
      }
Graphs of IQI profiles for given X-ray Exposures
- Profile graphs for 50KV 1 ma 50 sec
- Profile graphs for 40KV 1 ma 50 sec
- Profile graphs for 30KV 1 ma 50 sec
- Profile graphs for 20KV 1 ma 50 sec
- Profile graphs for 15KV 1 ma 50 sec
Images of IQI X-ray examinations for given Exposures
- High resolution image for 50KV 1 ma 50 sec
- High resolution image for 40KV 1 ma 50 sec
- High resolution image for 30KV 1 ma 50 sec
- High resolution image for 20KV 1 ma 50 sec
- High resolution image for 15KV 1 ma 50 sec